MobiusFlow View Turning Data into Actionable Insights
MobiusFlow provides powerful visualisation tools that transform complex IoT data into intuitive, actionable insights. These tools enable system integrators, facilities managers, and stakeholders to understand, manage, and optimise their systems more effectively.

Customisable Dashboards
Create tailored dashboards that present the most relevant data at a glance.
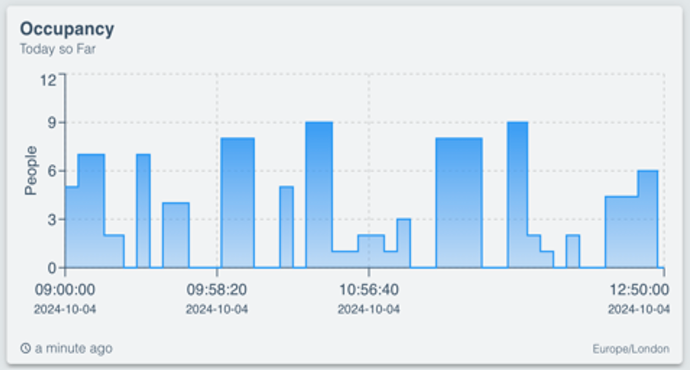
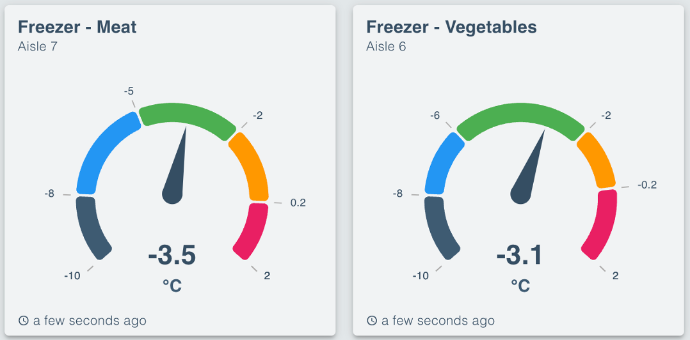
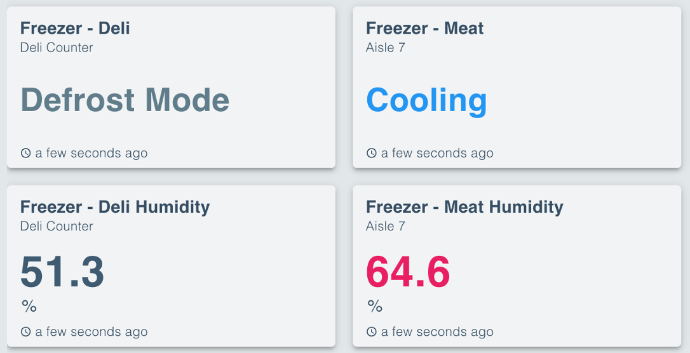
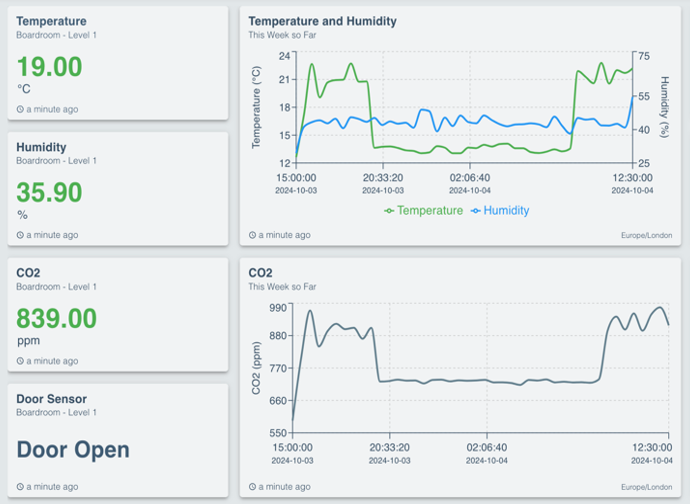
Widgets for graphs, charts, and gauges help visualise key metrics like energy consumption, occupancy levels, and device performance.
Real-Time Data Monitoring
Track live data from sensors, devices, and systems, enabling faster decision-making.
Visual indicators alert users to anomalies, ensuring immediate response to critical issues.

Actionable Insights
Aggregate and analyse data to identify patterns and trends, such as energy inefficiencies or maintenance needs.
Translate these insights into automated workflows for optimised operations.
Notify specific people within your organisation via Automated Alerts (Email / Text) when items exceed or drop below preset parameters.
Custom Reports
Generate detailed reports based on your visualised data, catering to specific business needs.
Export reports for stakeholders or regulatory compliance with ease.

User-Friendly Interface
Designed to be accessible to both technical and non-technical users.
Drag-and-drop functionality and pre-configured templates simplify the creation of visual elements.
Multi-Protocol Support
Integrate and visualise data from multiple devices and systems, regardless of the protocol. including legacy data and historical information (databases etc).
A unified view helps eliminate silos and improves decision-making across departments.
Scalability
Handle increasing data volumes as your IoT infrastructure grows, without losing clarity or functionality.
Deployment
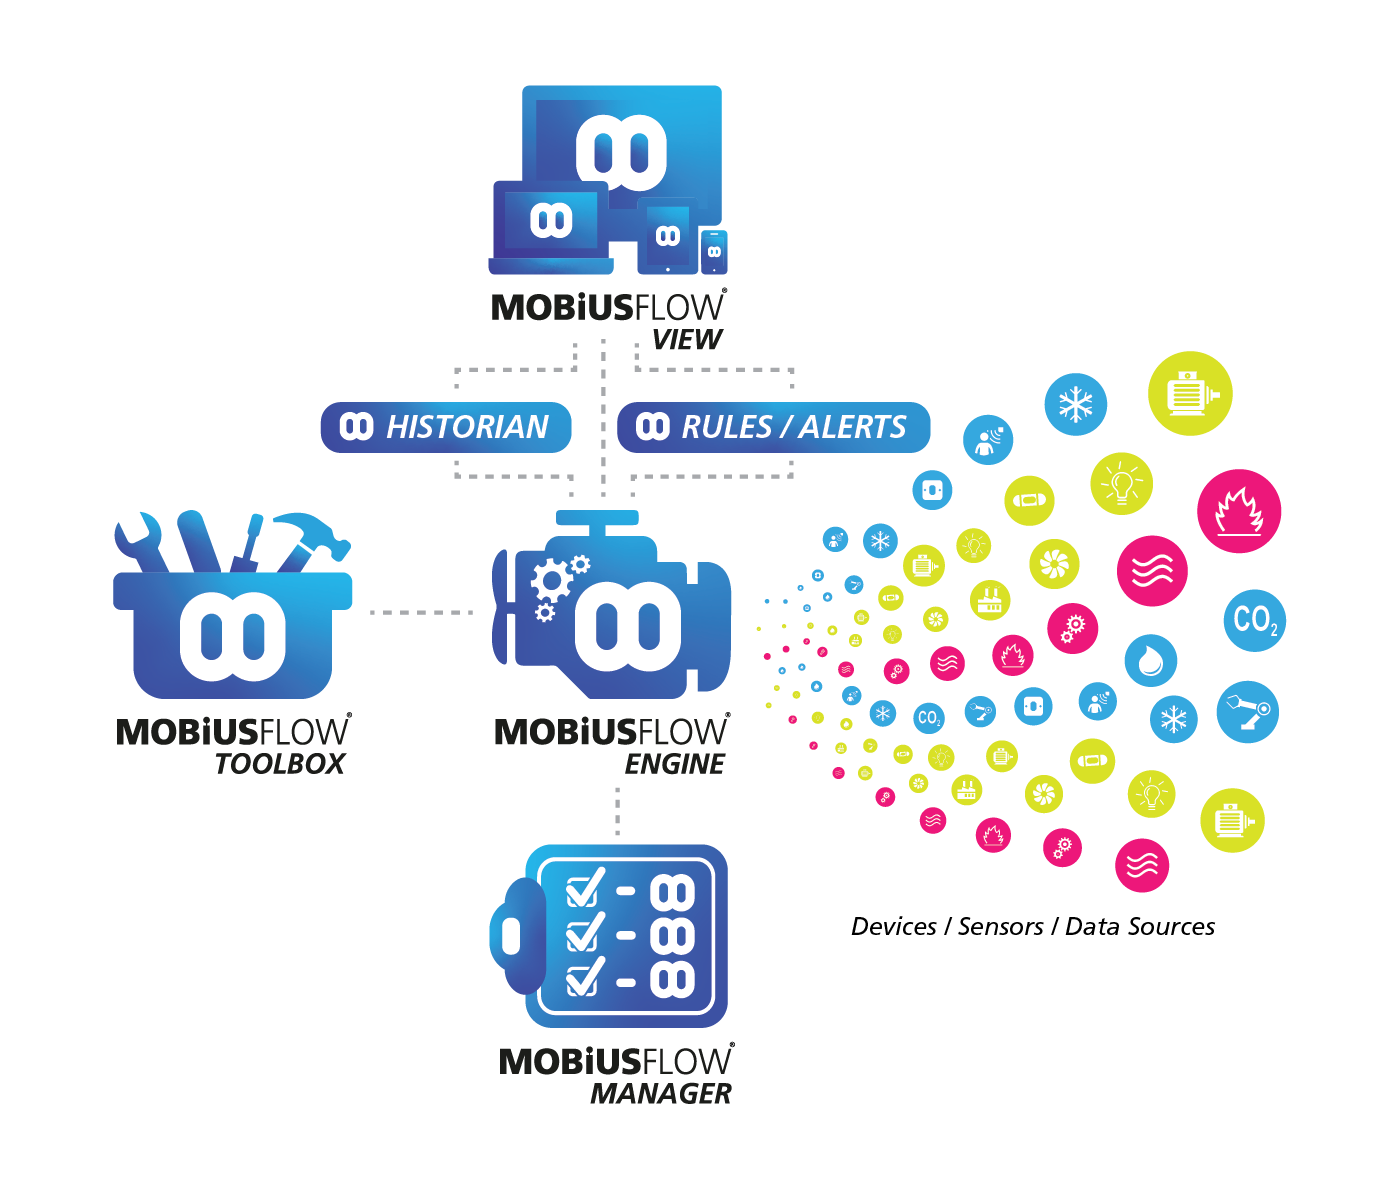
How 'View' Fits into the MobiusFlow Ecosystem:
Visualisation via MobiusFlow View
The engine feeds processed and normalised data into MobiusFlow View, which displays it through customised dashboards, charts, and graphs.Rules, Alerts and Data Storage:
Rules and Alerts can be set via the Toolbox or through the View (coming soon). Optional data storage can be added via the historian.Deployment of the configuration via MobiusFlow Engine
Centralised hub that connects sensors, devices, and systems, enabling seamless communication, automation, and data processing based on the settings deployed via the toolbox. Can be deployed locally or in the cloud as connected or standalone system (or both).Configuration via MobiusFlow Toolbox:
The engine is configured and managed using the MobiusFlow Toolbox, where users define workflows, connect devices, and set up data flows.- Manage with MobiusFlow Manager:
Manage each instance / installation of MobiusFlow using MobiusFlow Manager
Ready to Connect, Control & Communicate?
Set yourself up for success with reduced development costs and optimised integration efficiency for you and your customers!